Insights - Productivity Dashboard
Project Overview
In today's fast-paced business environment, effective management of time and tasks is a critical concern. While numerous tools exist for task and time management, integrating these into a cohesive, insightful overview remains a challenge. This project addresses that gap by offering a unified platform that combines data from various productivity tools, providing comprehensive insights into daily activities.
Role in the Project
As a Product Designer, my responsibilities included overseeing the entire design process, from user research to the final interactive design, ensuring the product effectively met the needs of our target audience.
The owner of project had access to multiple communities and online teams which helped us a lot for User research and understanding the real needs of the people we are going to design a product for. connecting and testing ideas with those users was a big part of my role in this project. which helped me a lot in understanding what empathy really means and how should I leave my biases behind when trying to build a product for specific group of users.
Objective
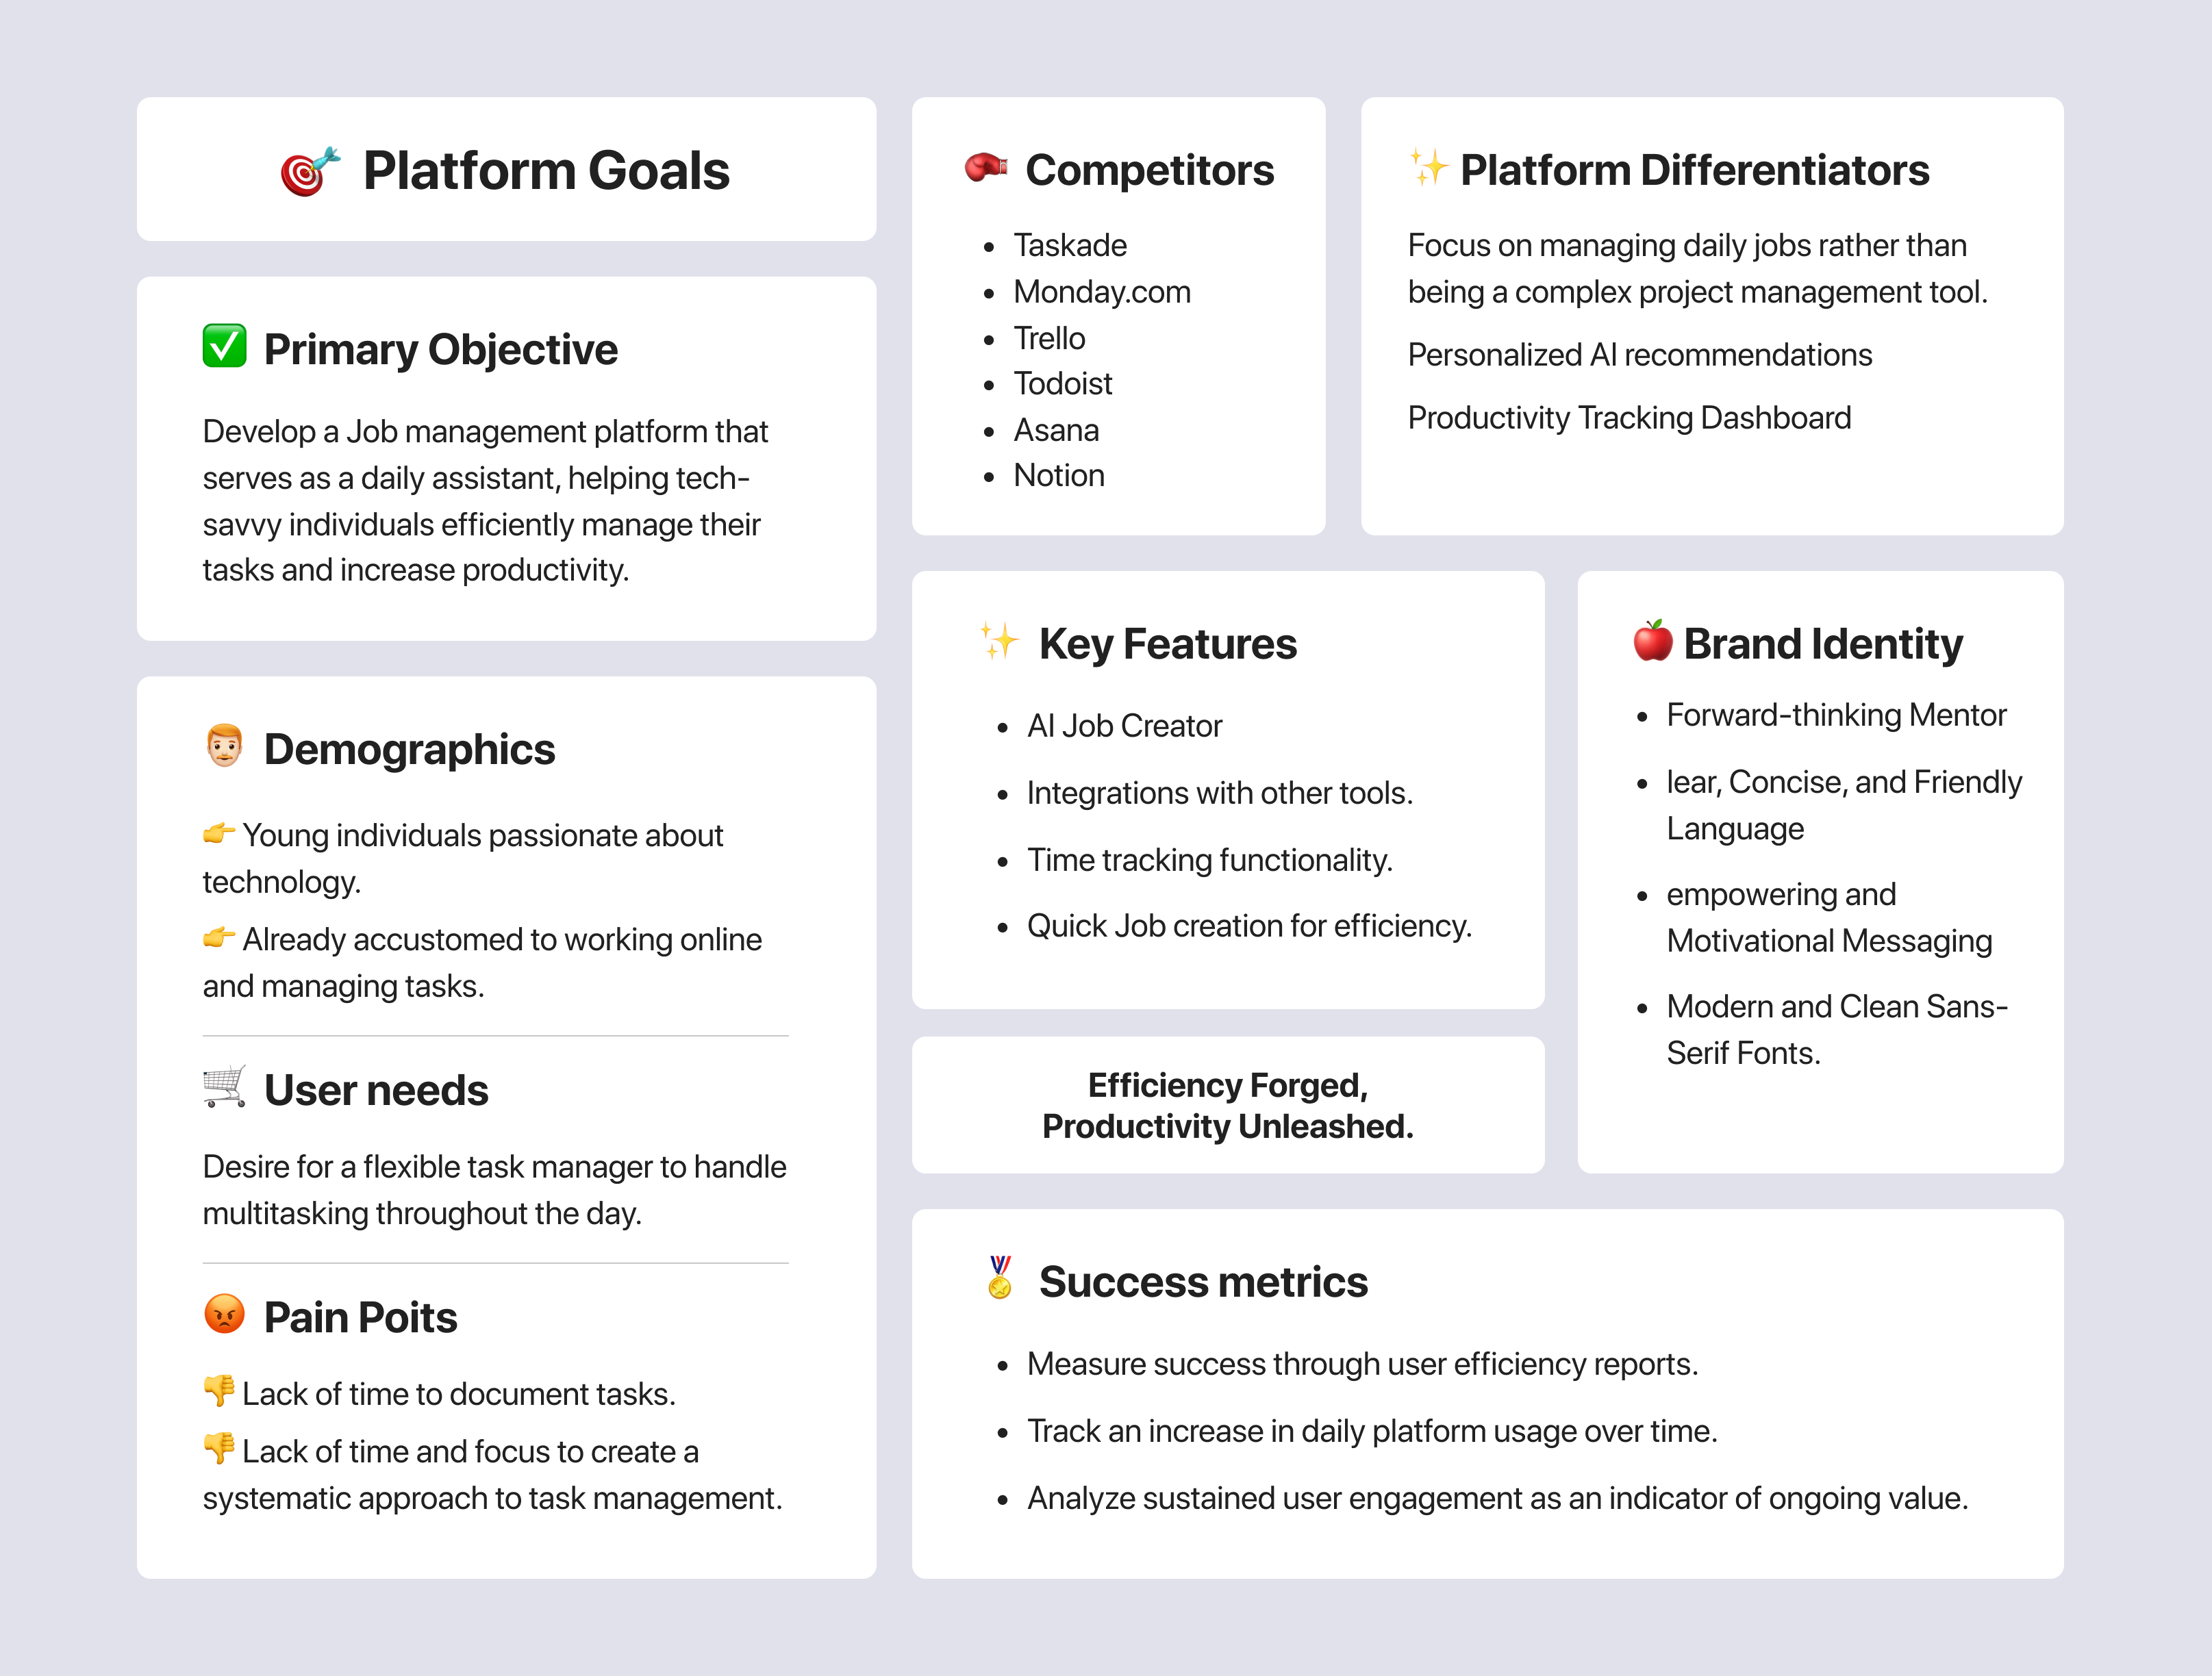
To develop an intuitive, unified Productivity management platform that seamlessly integrates with existing productivity tools, catering to the needs of dynamic, tech-savvy professionals who require efficient multitasking capabilities. The platform aims to streamline task management, Time Tracking, and Report Creation to enhance daily productivity, and offer actionable insights through personalized data visualization, ultimately empowering users to manage their time more effectively and increase their output.
These are the overall objectives we had:
- Integrated Reporting: Developing a system to collate and visualize data from multiple productivity tools, thereby enabling users to monitor their activities and productivity effectively.
- Functional Consolidation: Integrating key functionalities of various tools into a single, cohesive product.
Challenges and Solutions
1. Data Visualization and Prioritization
Challenge: Effectively visualizing and prioritizing different data types to enhance user productivity.
Solution: Designing various charts and reports tailored to specific timeframes and use cases, along with interactive report features.
2. User Engagement and Productivity Enhancement
Challenge: Encouraging users to boost their productivity and efficiency.
Solution: Implementing leaderboards and gamification elements to foster a competitive spirit in workspaces.
3. Task Time Analysis
Challenge: Providing users with clear insights into the time spent on each task.
Solution: Merging data from task managers with time trackers to generate detailed time reports for tasks.
Process and Development
1. Conducting User Research.
Involved gathering data about the users' needs and preferences. This included surveys, interviews, and observation to understand how users interact with current productivity tools and identify their pain points.
2. Defining User Problems
Identified key issues faced by users such as the challenge of managing tasks across different platforms, the need for a more streamlined process, and the difficulty in maintaining focus due to task overloads. these are some of the problems we've found:
Data-driven platform - Simplicity Over Feature Overload - Productivity Measurement - Focus Challenges - Integration Complexity
3. Ideating and Selecting Solutions.
generated ideas that could address the user problems, such as integrating a platform with existing productivity tools, creating a system for prioritizing tasks, and introducing AI for personalized recommendations. Selected the best ideas based on feasibility and potential impact on productivity.
4. Developing Concept Designs.
Created design concepts that reflect the need for a simple yet effective job management platform, incorporating elements like an AI job creator and time tracking functionalities.
5. Creating Prototypes.
published prototypes to test the concept designs, focusing on ease of use, to make sure users will connect with the product and how it might help them to get overview of their activities.
6. Validating Solutions with User Tests.
Conducted tests with real users to validate the proposed solutions. Feedback was collected to refine the platform's functionality and ensure it met the intended user needs.
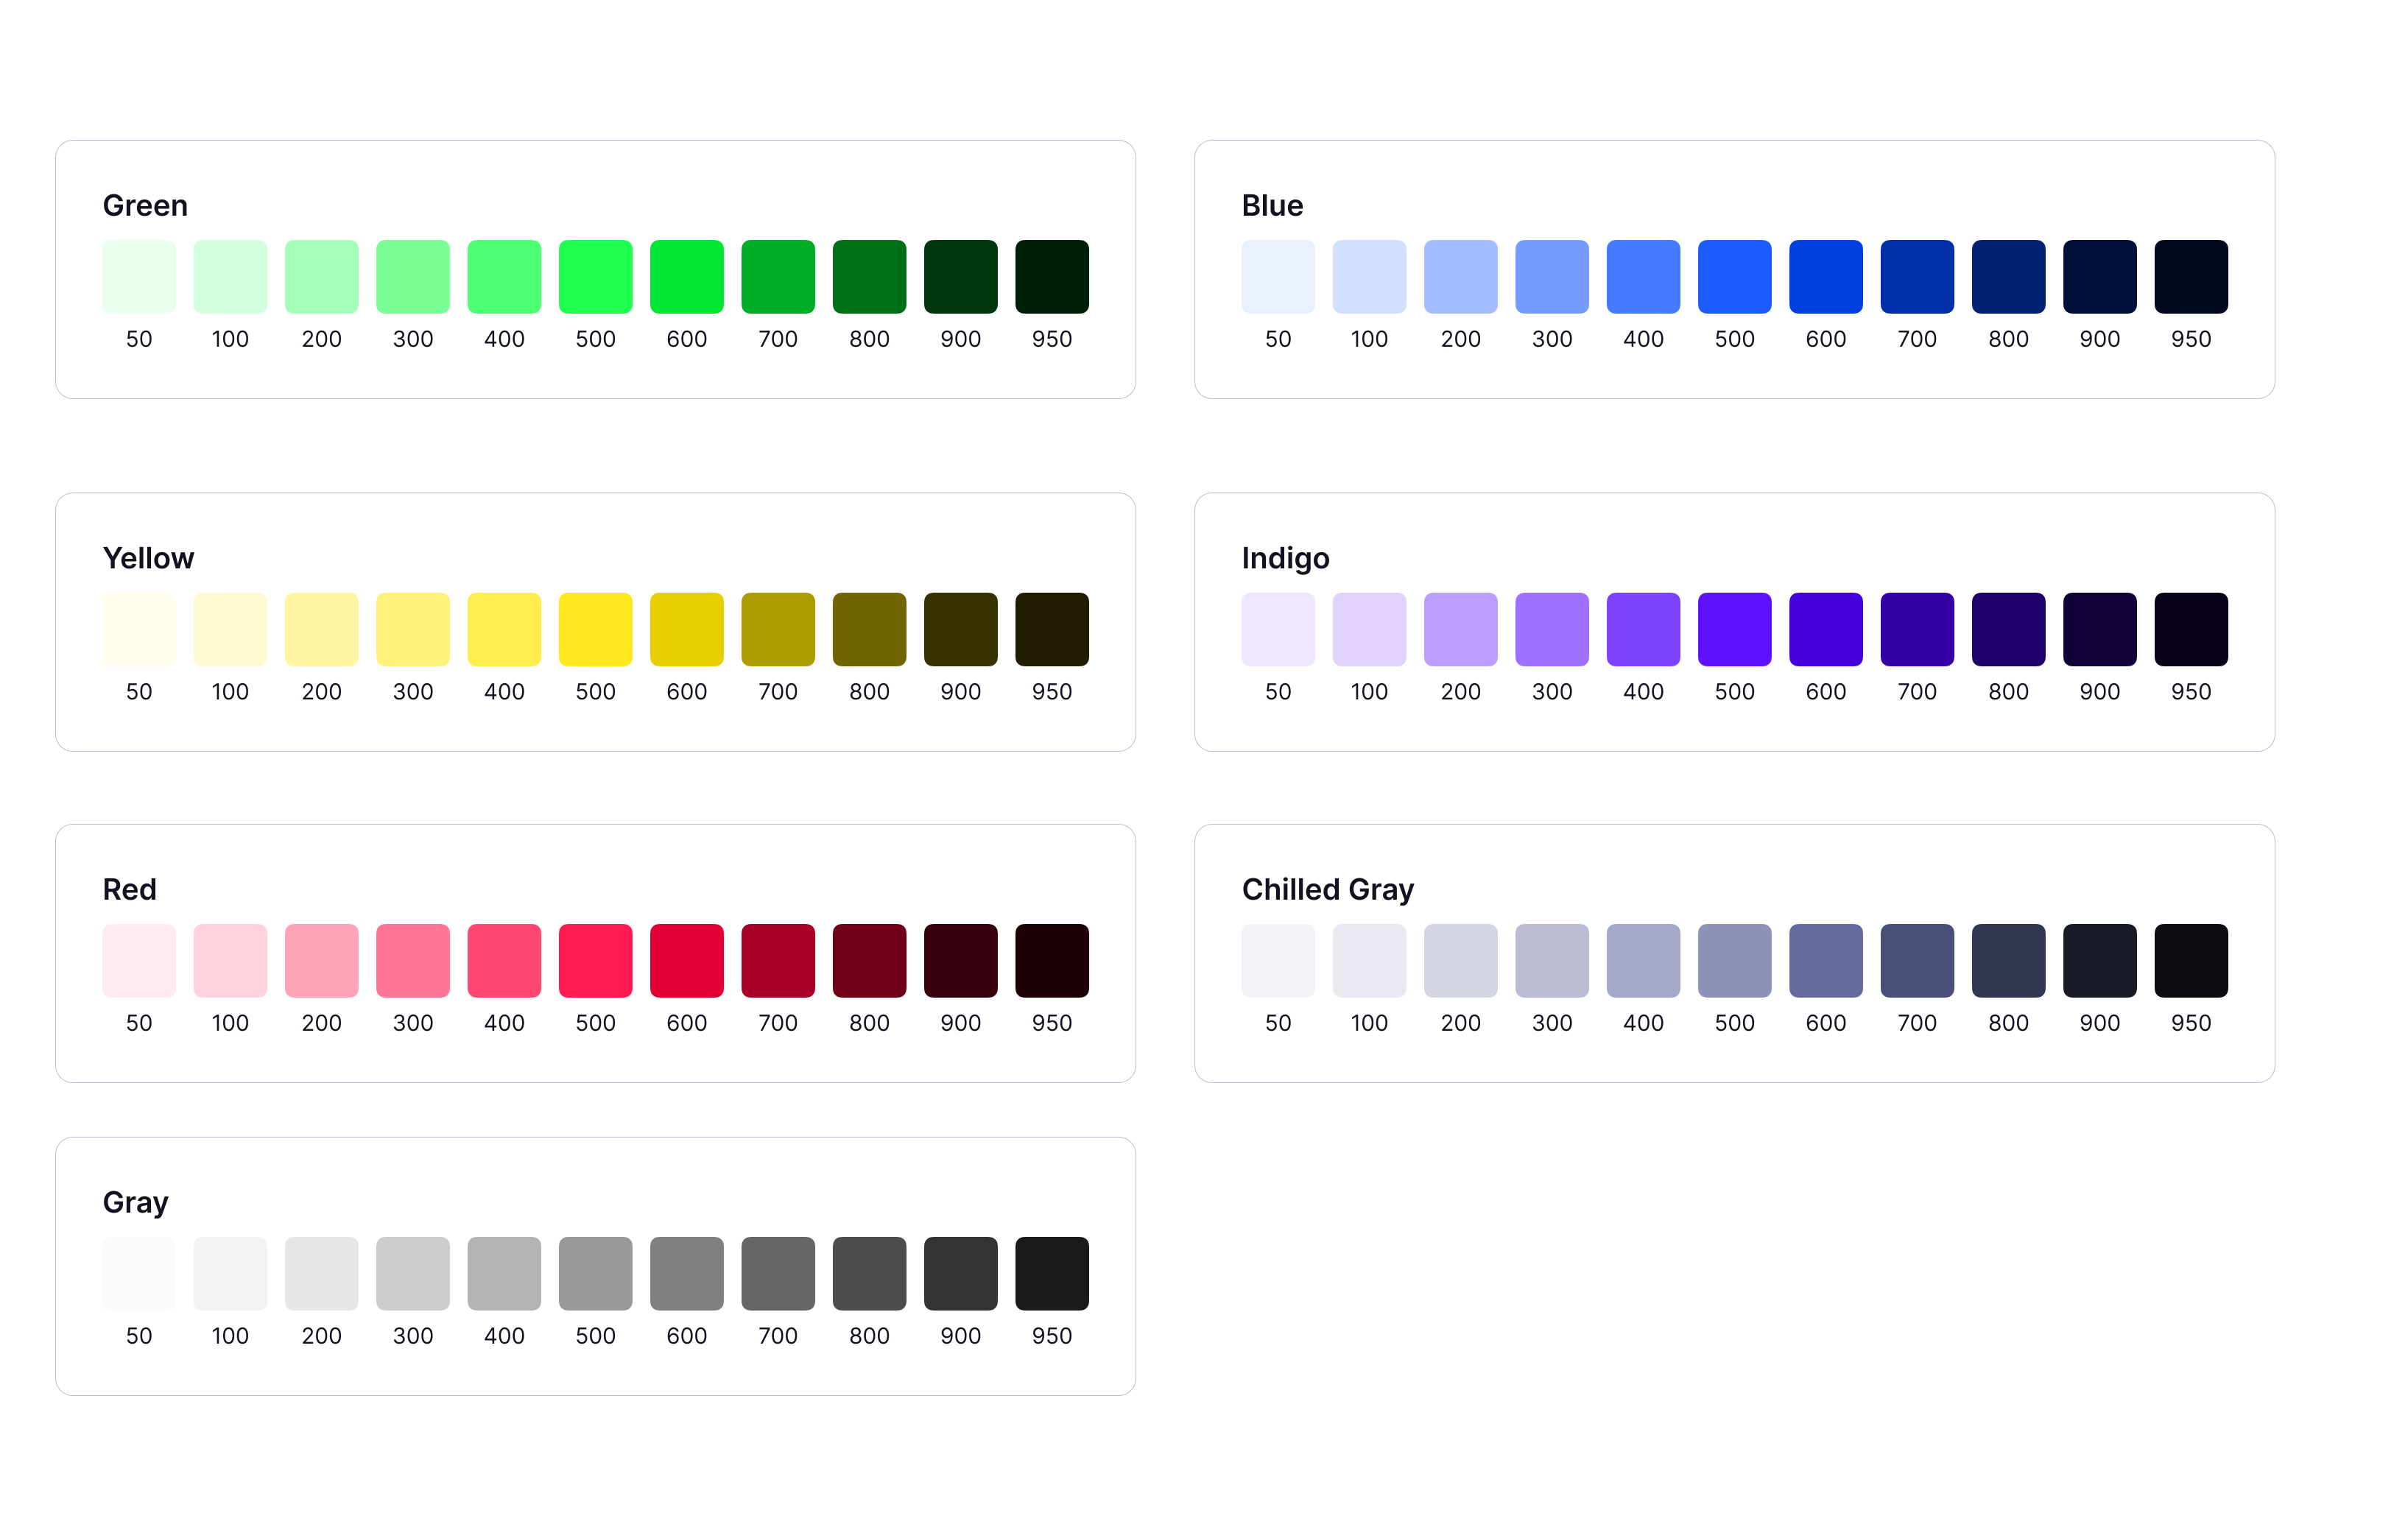
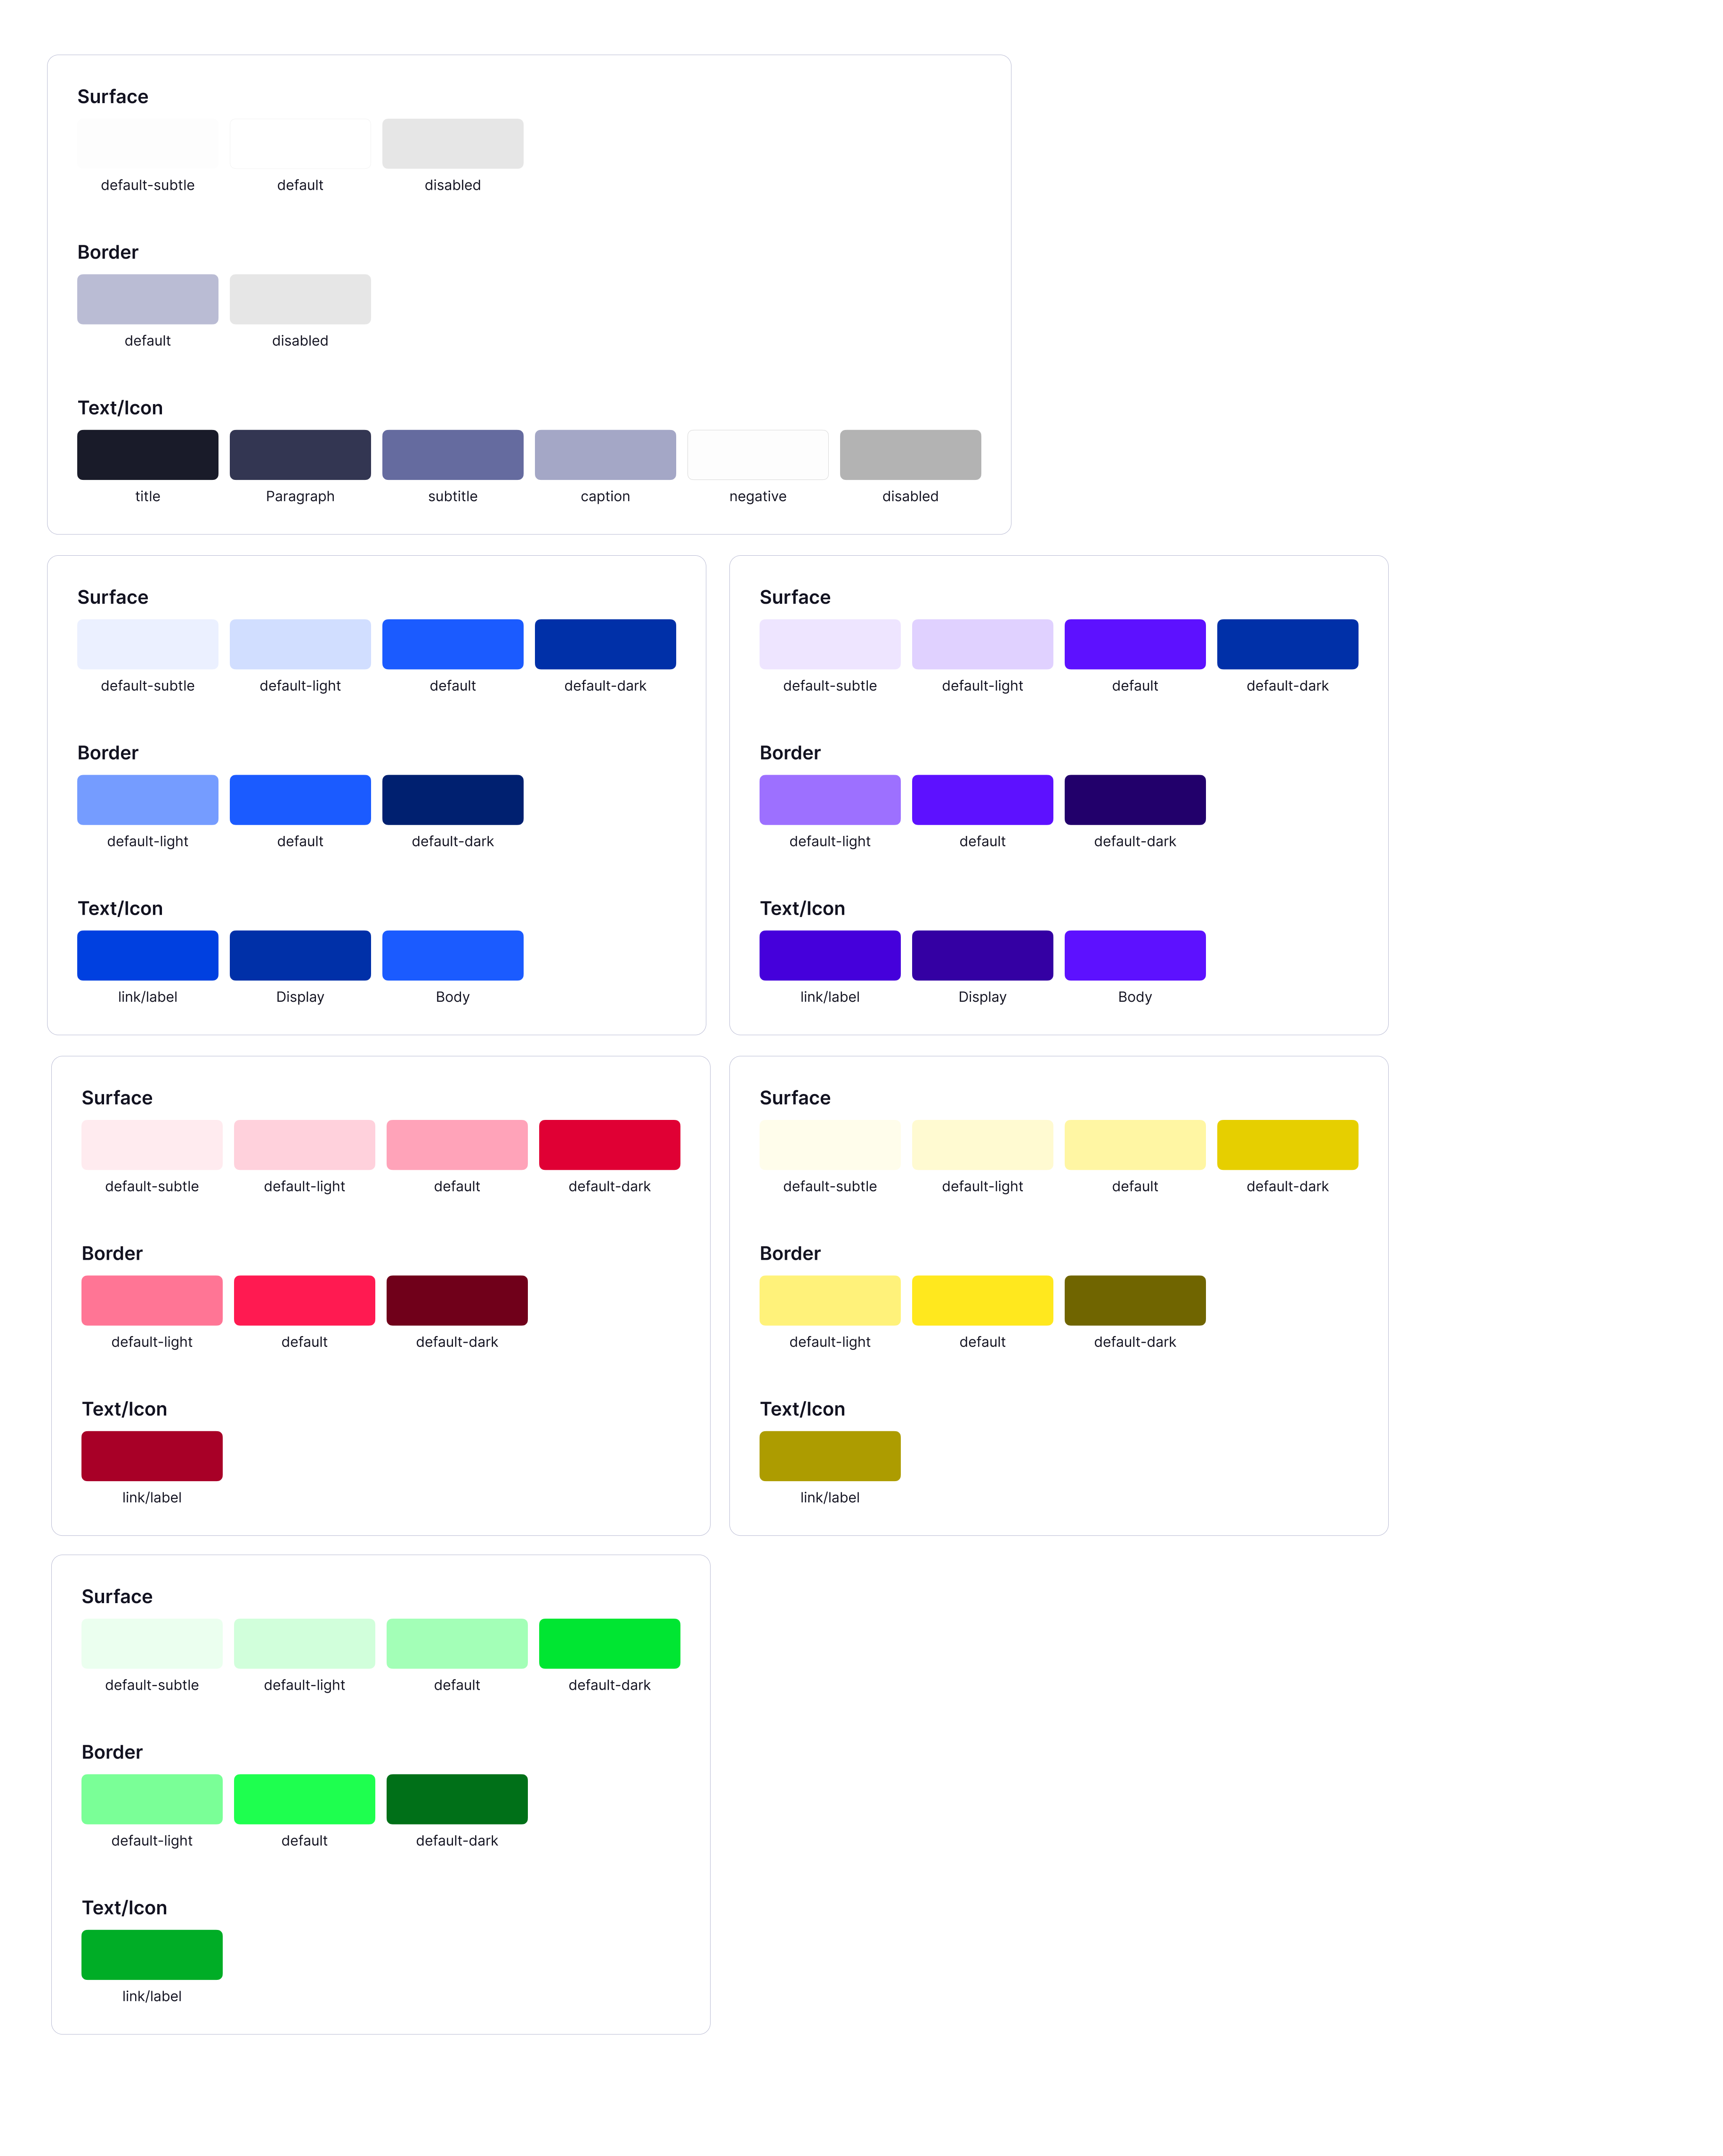
7. Customizing the Design System.
Customized the "Flowbite" design system based on the platform's goals and the users' environment. Ensured the system was equipped with modern and clean sans-serif fonts, reflecting the brand identity of a forward-thinking mentor. Also Localized the styles to create design tokens to be more structured and connected with development team.
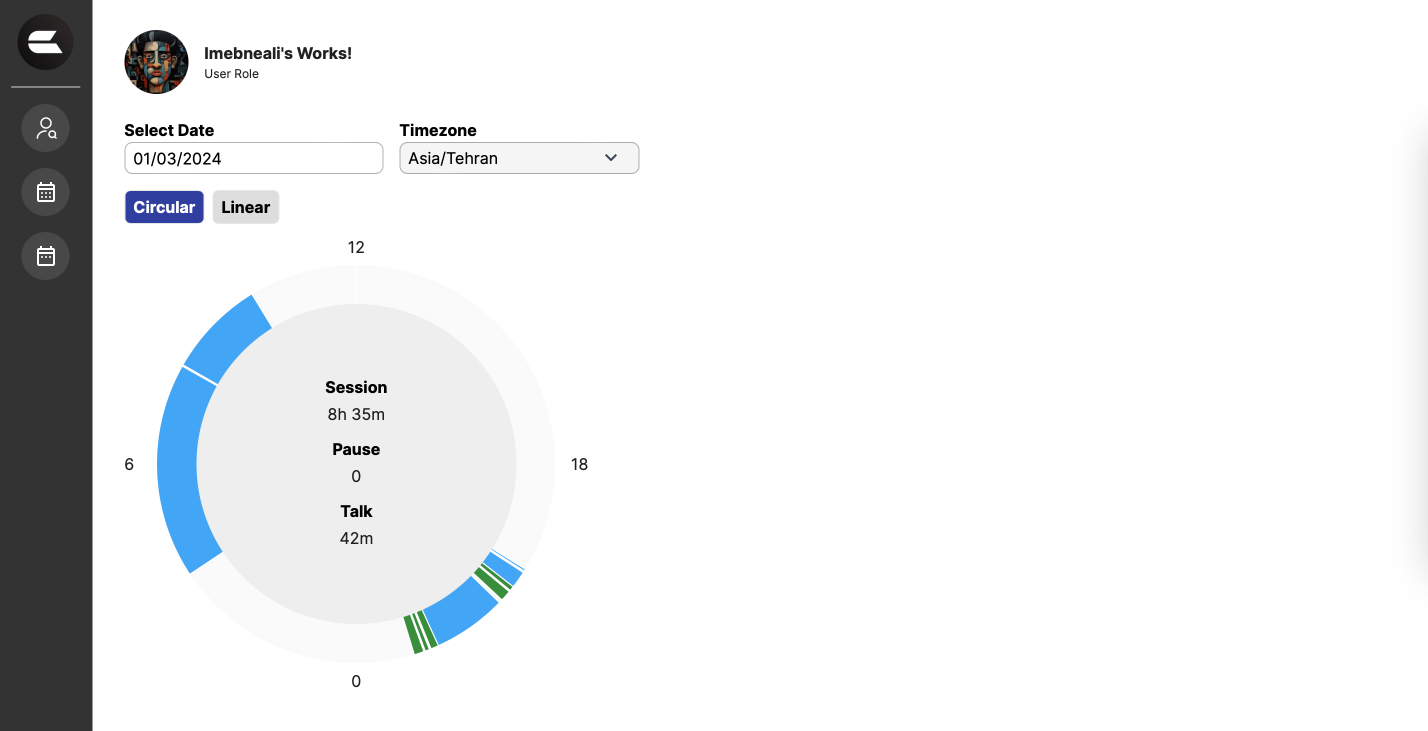
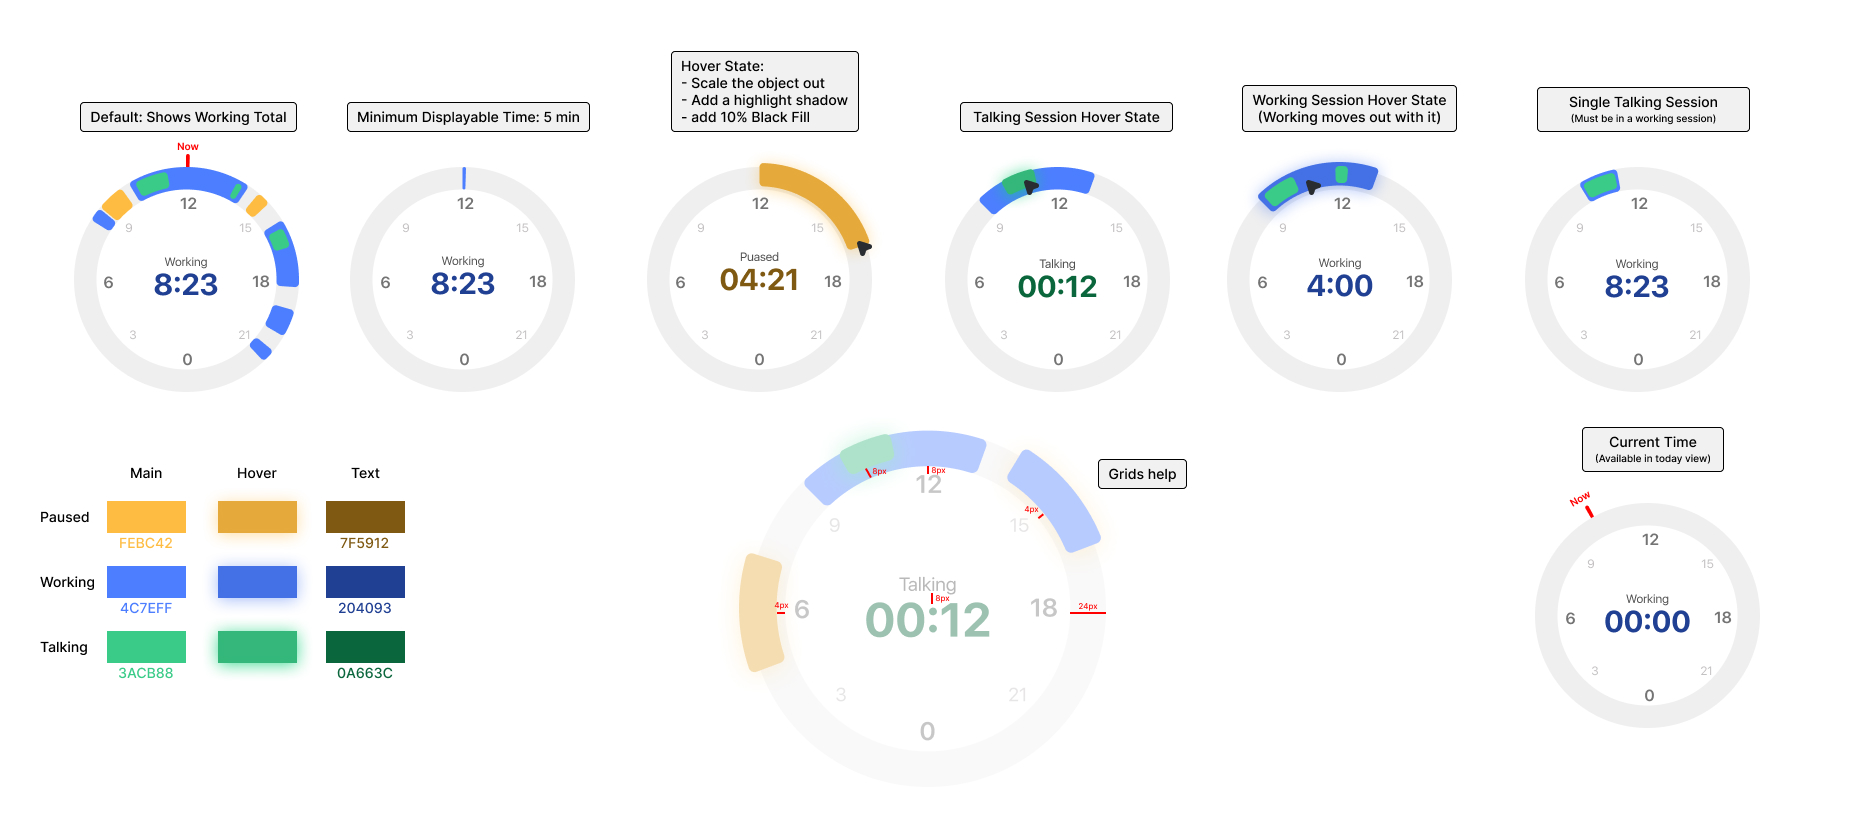
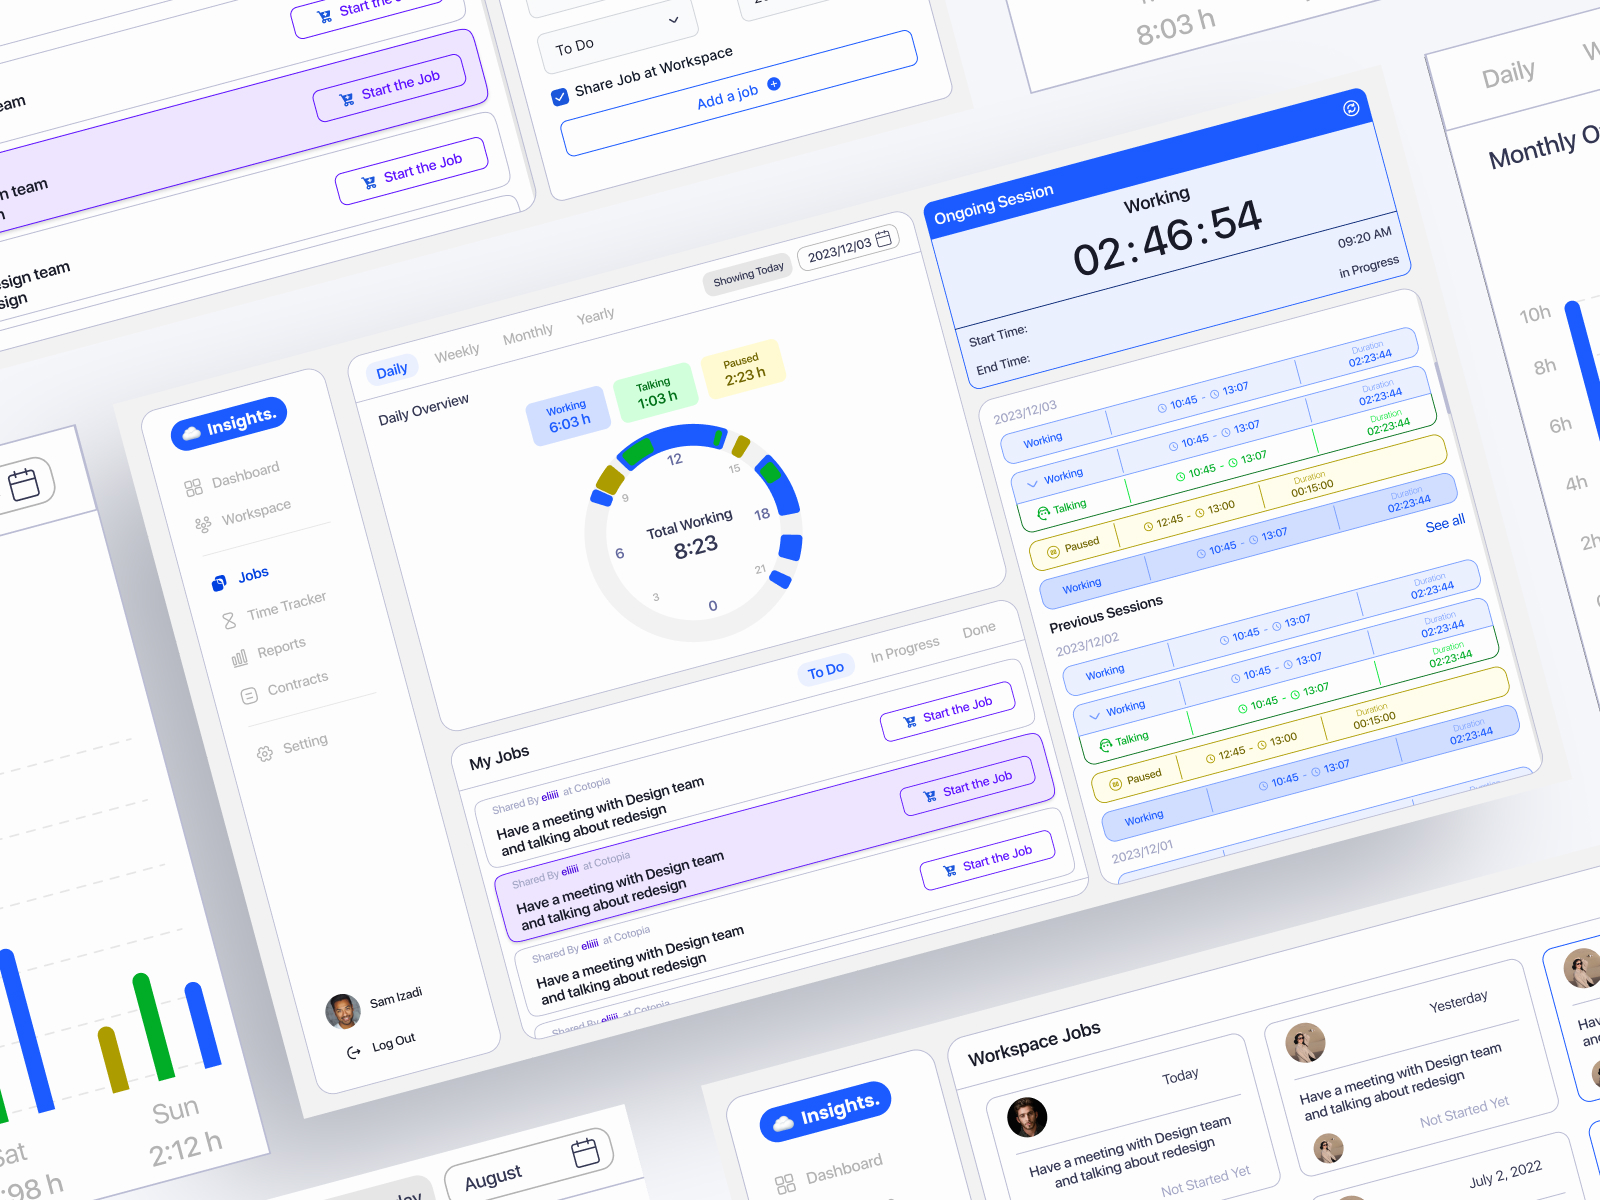
8. Designing Interactive Charts.
Charts were a big part of the product, I've Designed charts that would not only visually represent productivity data but also allow users to interact with the information to gain deeper insights into their task management and time allocation. Different type of charts have been designed for different timeframes so the users would have access to data that is most important in each timeframe.
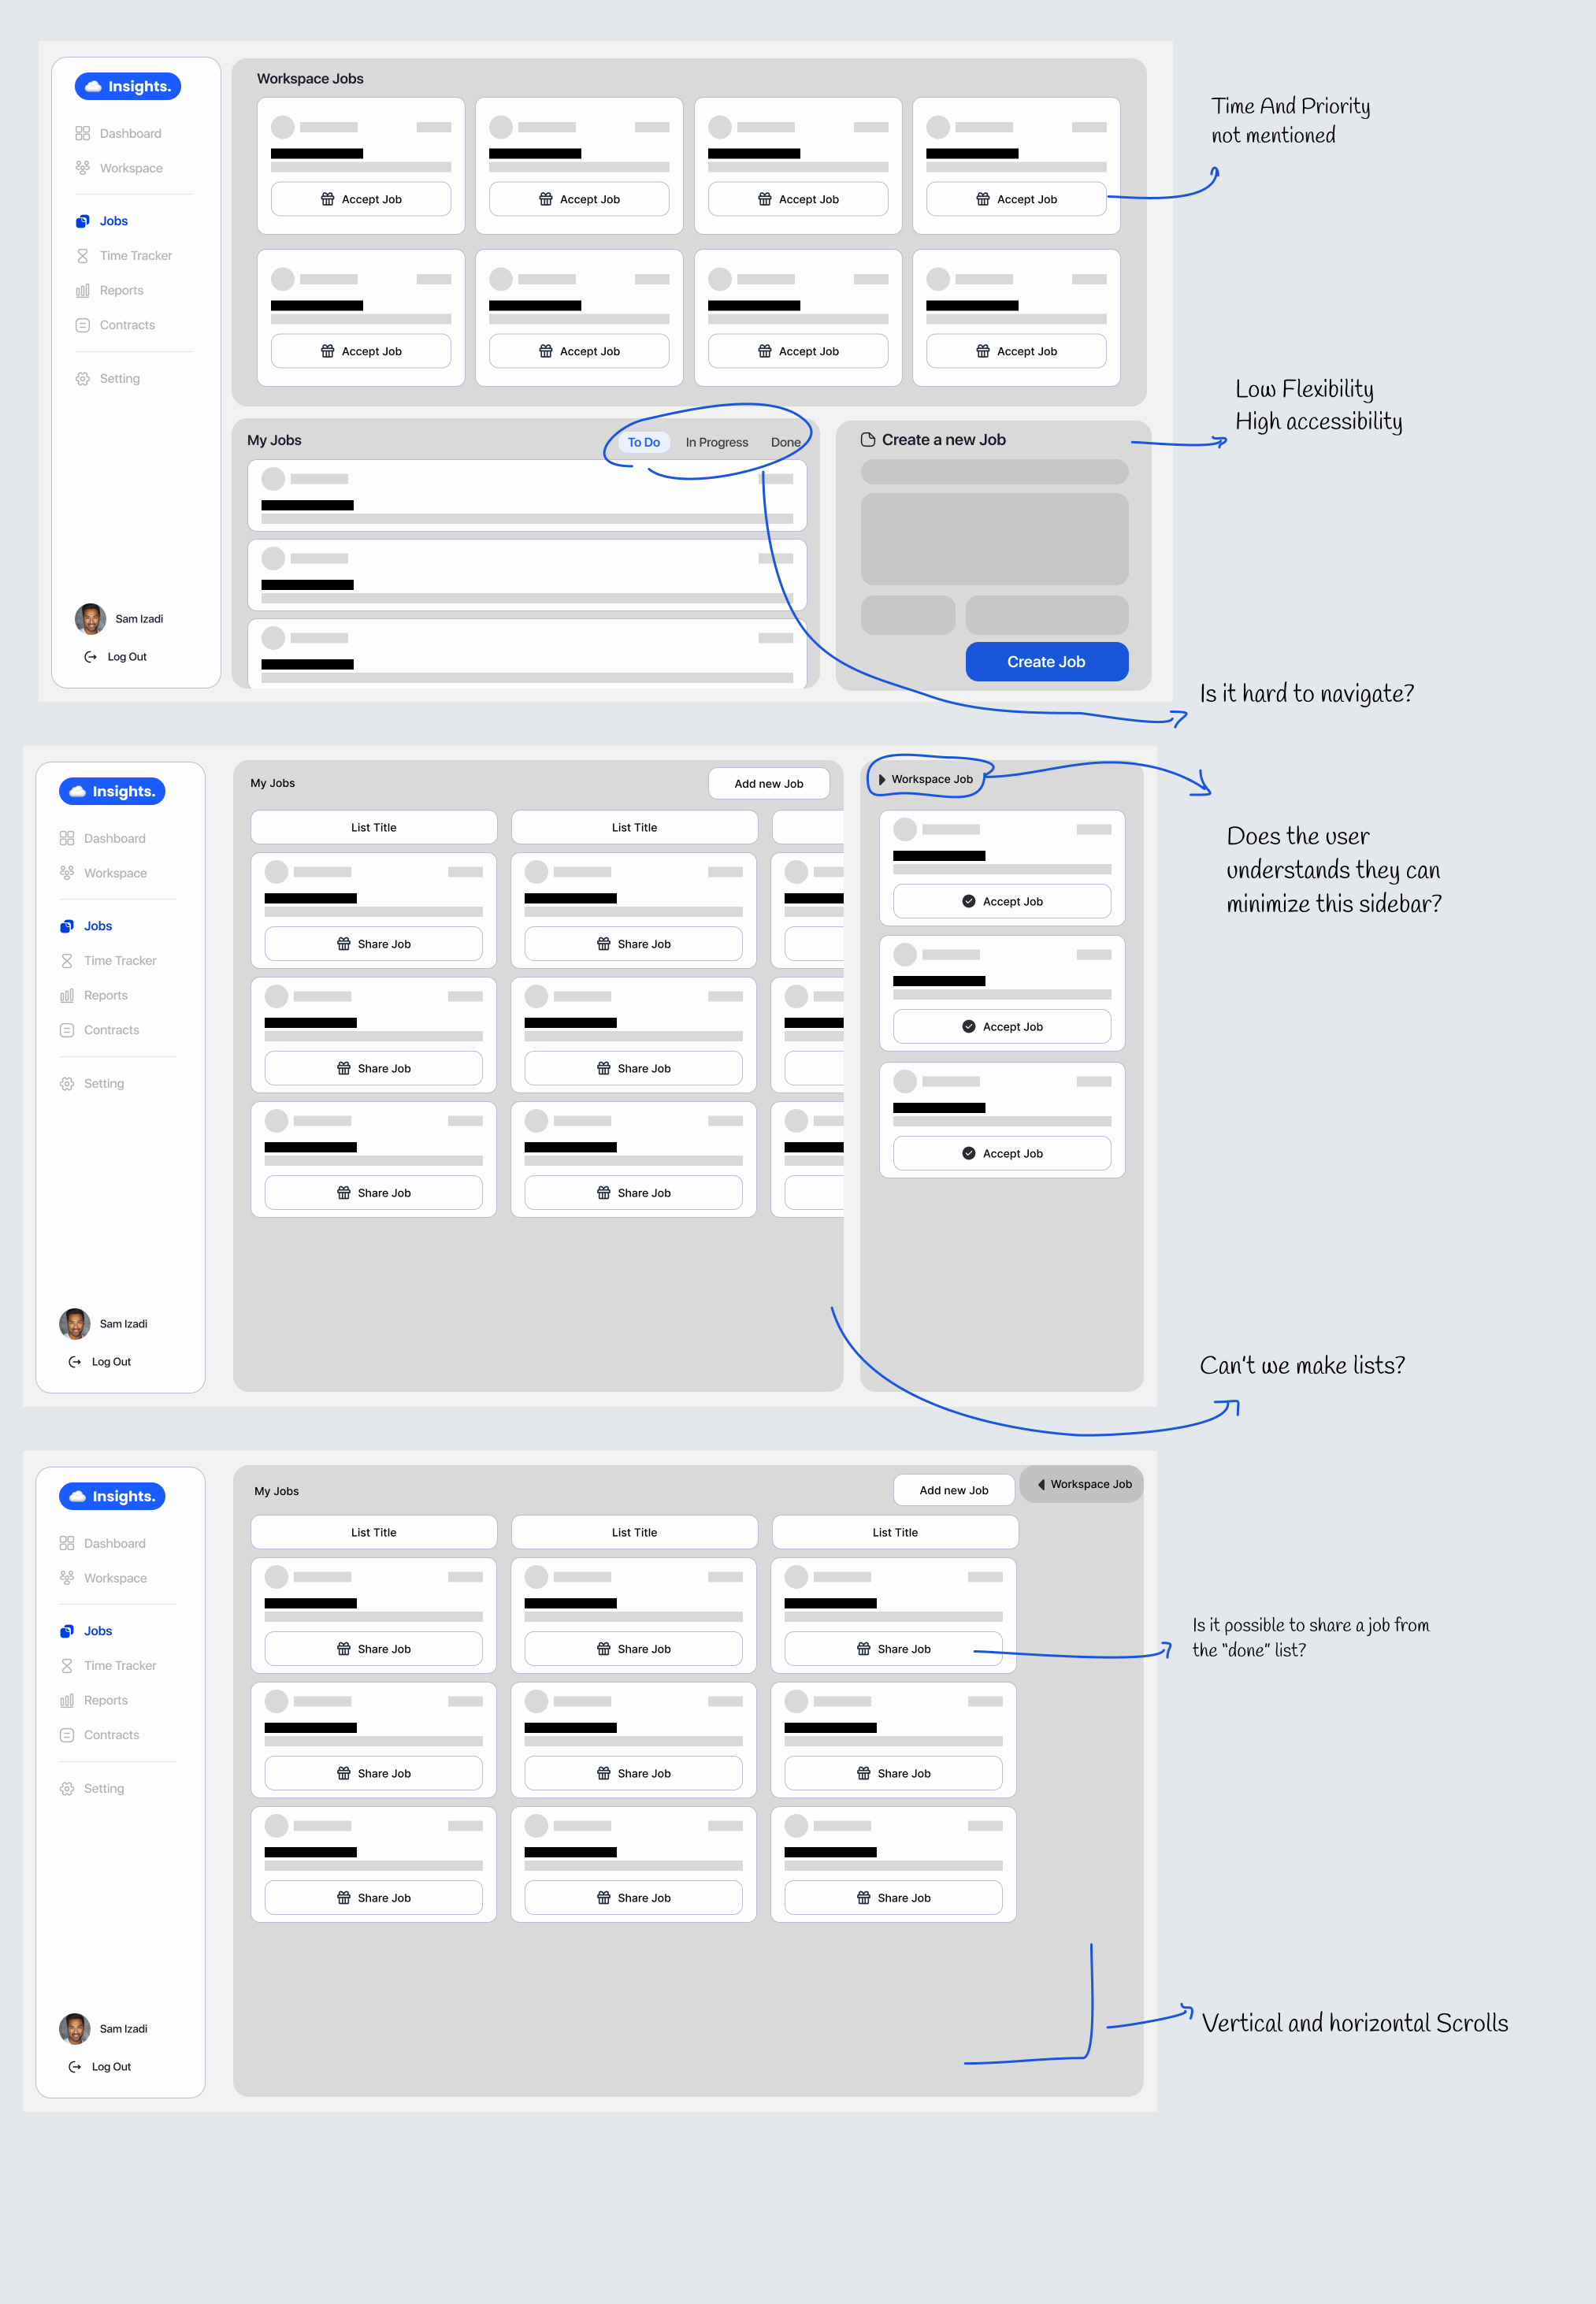
9. Wire-framing.
Created wireframes for the platform's interface, detailing the layout and placement of features like the Task Management(Jobs), integration points with other tools, and the productivity dashboard.
10. Crafting Main UI and Responsive Designs.
Designed the main user interface with a focus on clarity and responsiveness, ensuring that the platform's tools and features are easily accessible on any device.
User Research and Feedback
- Carrying out Interviews.
- Testing Prototypes.
- Analyzing Competitors.
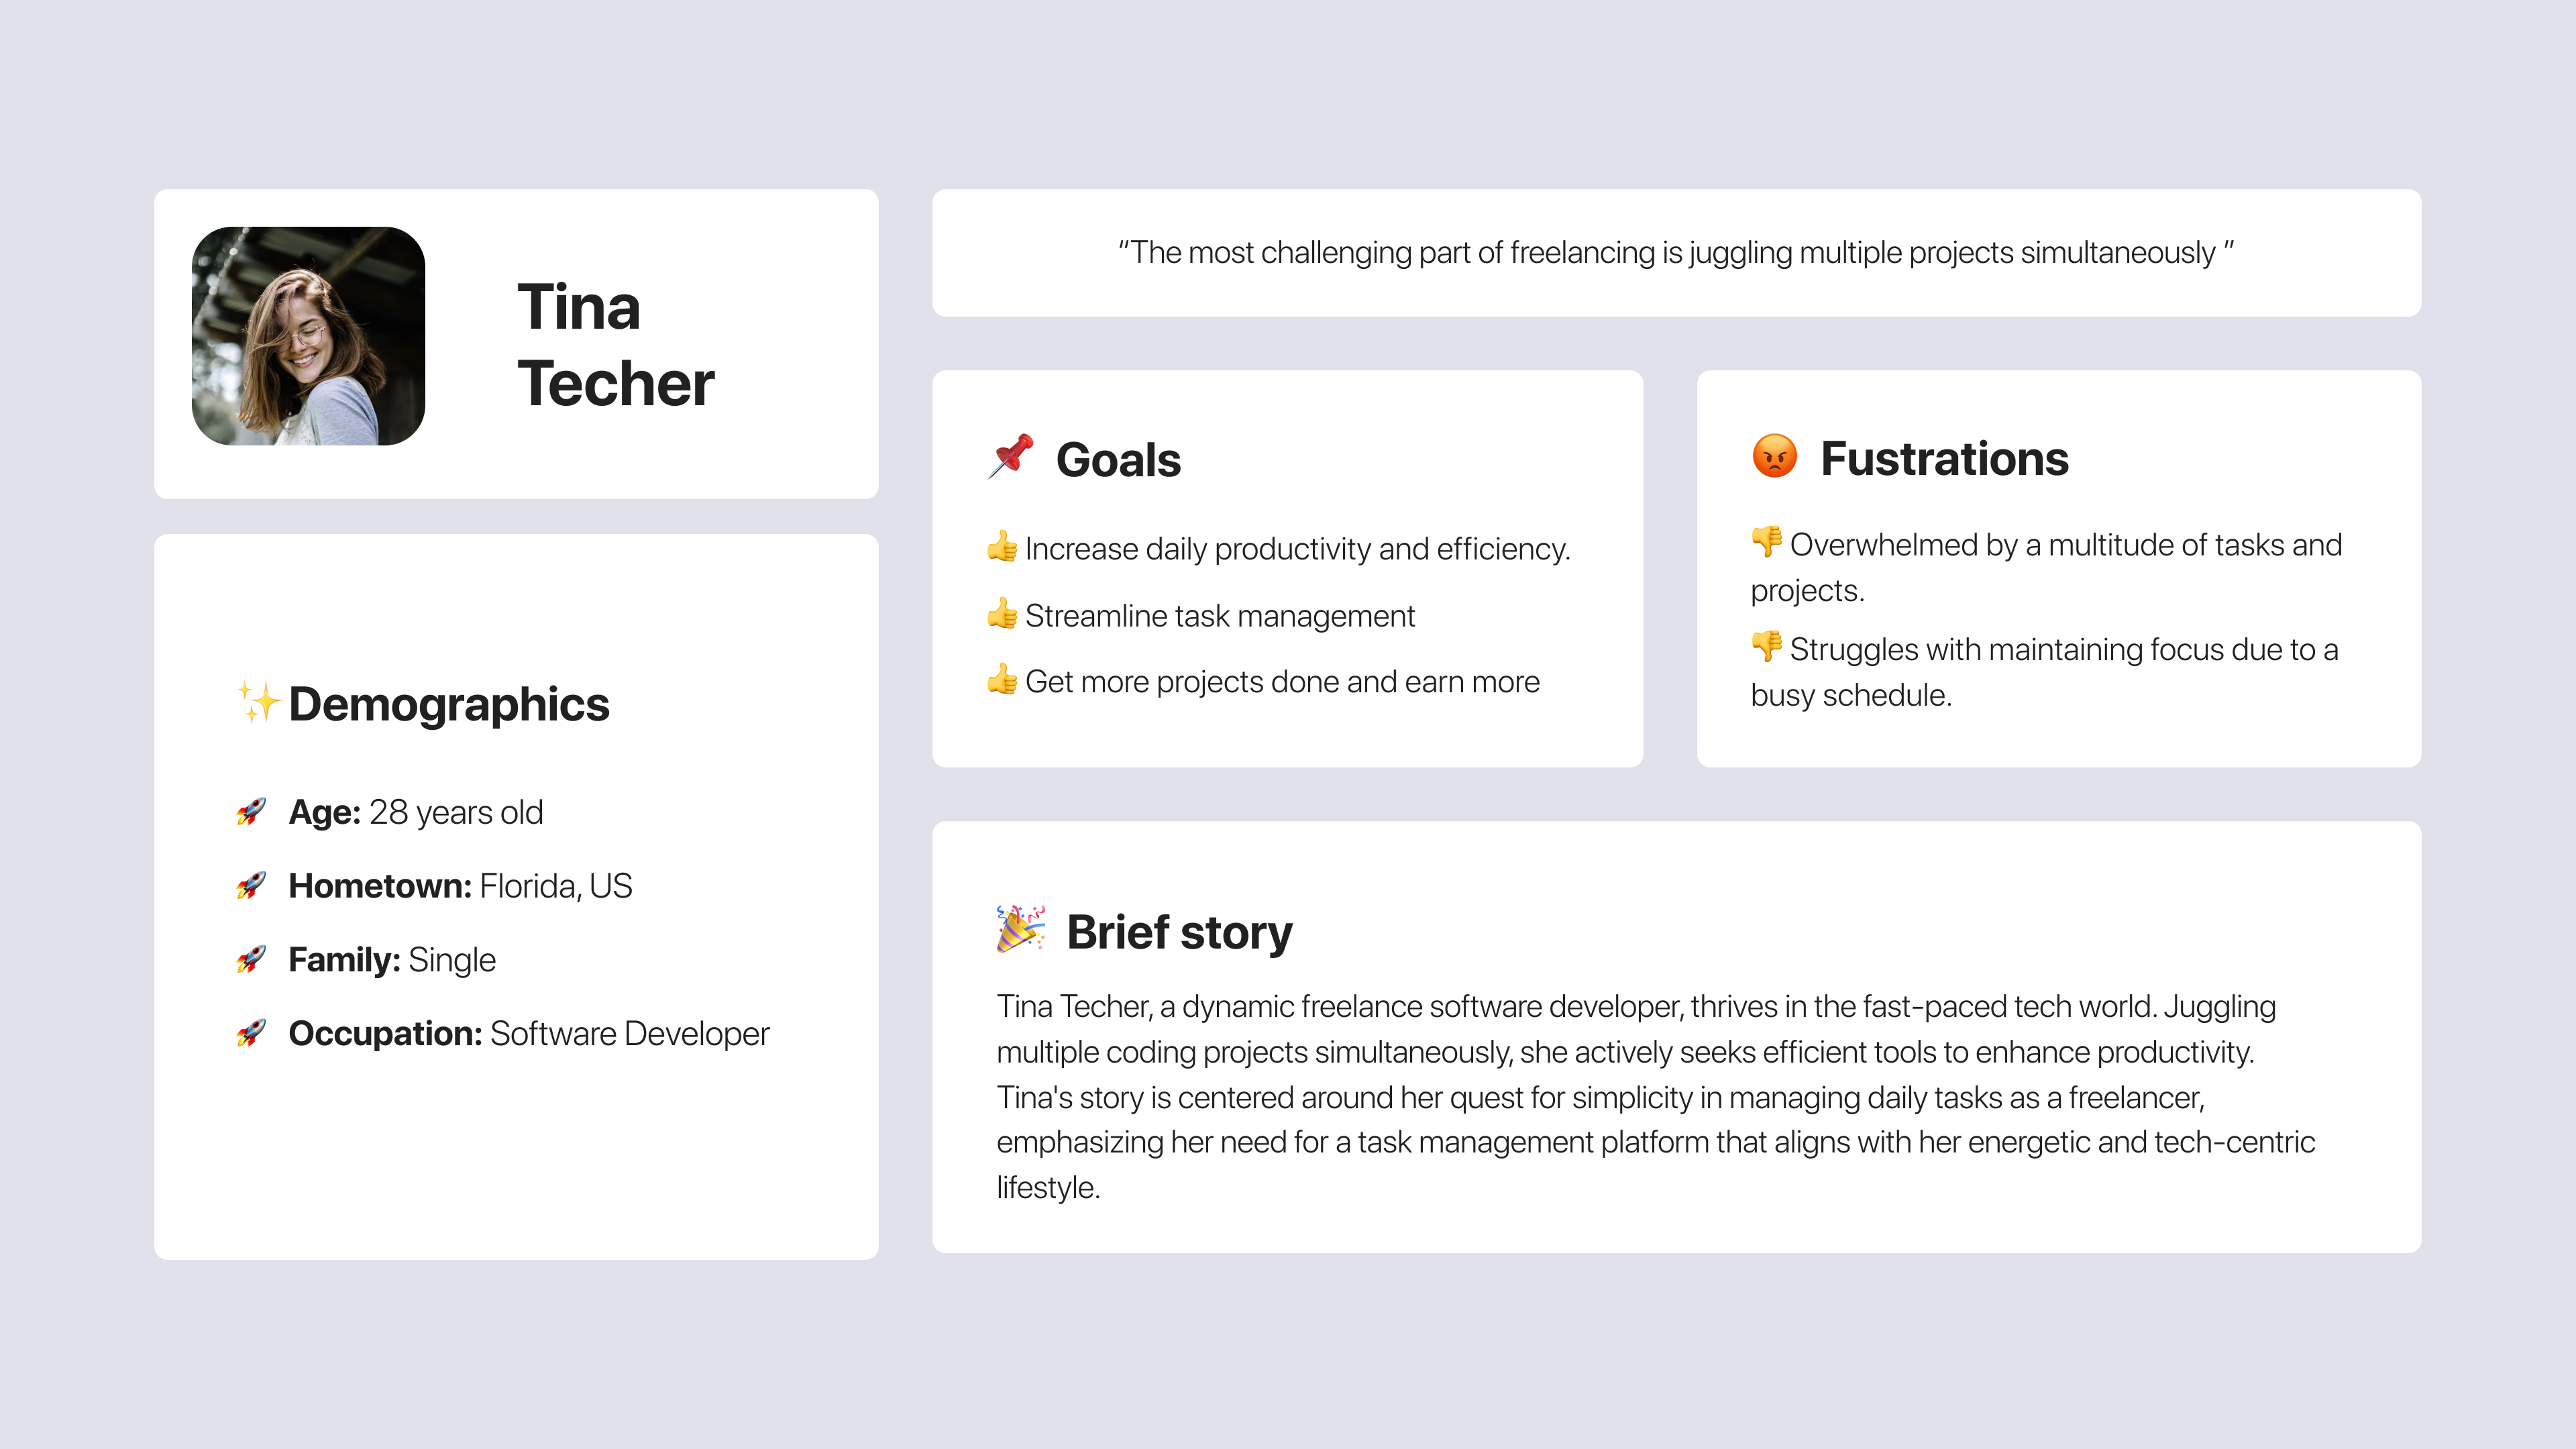
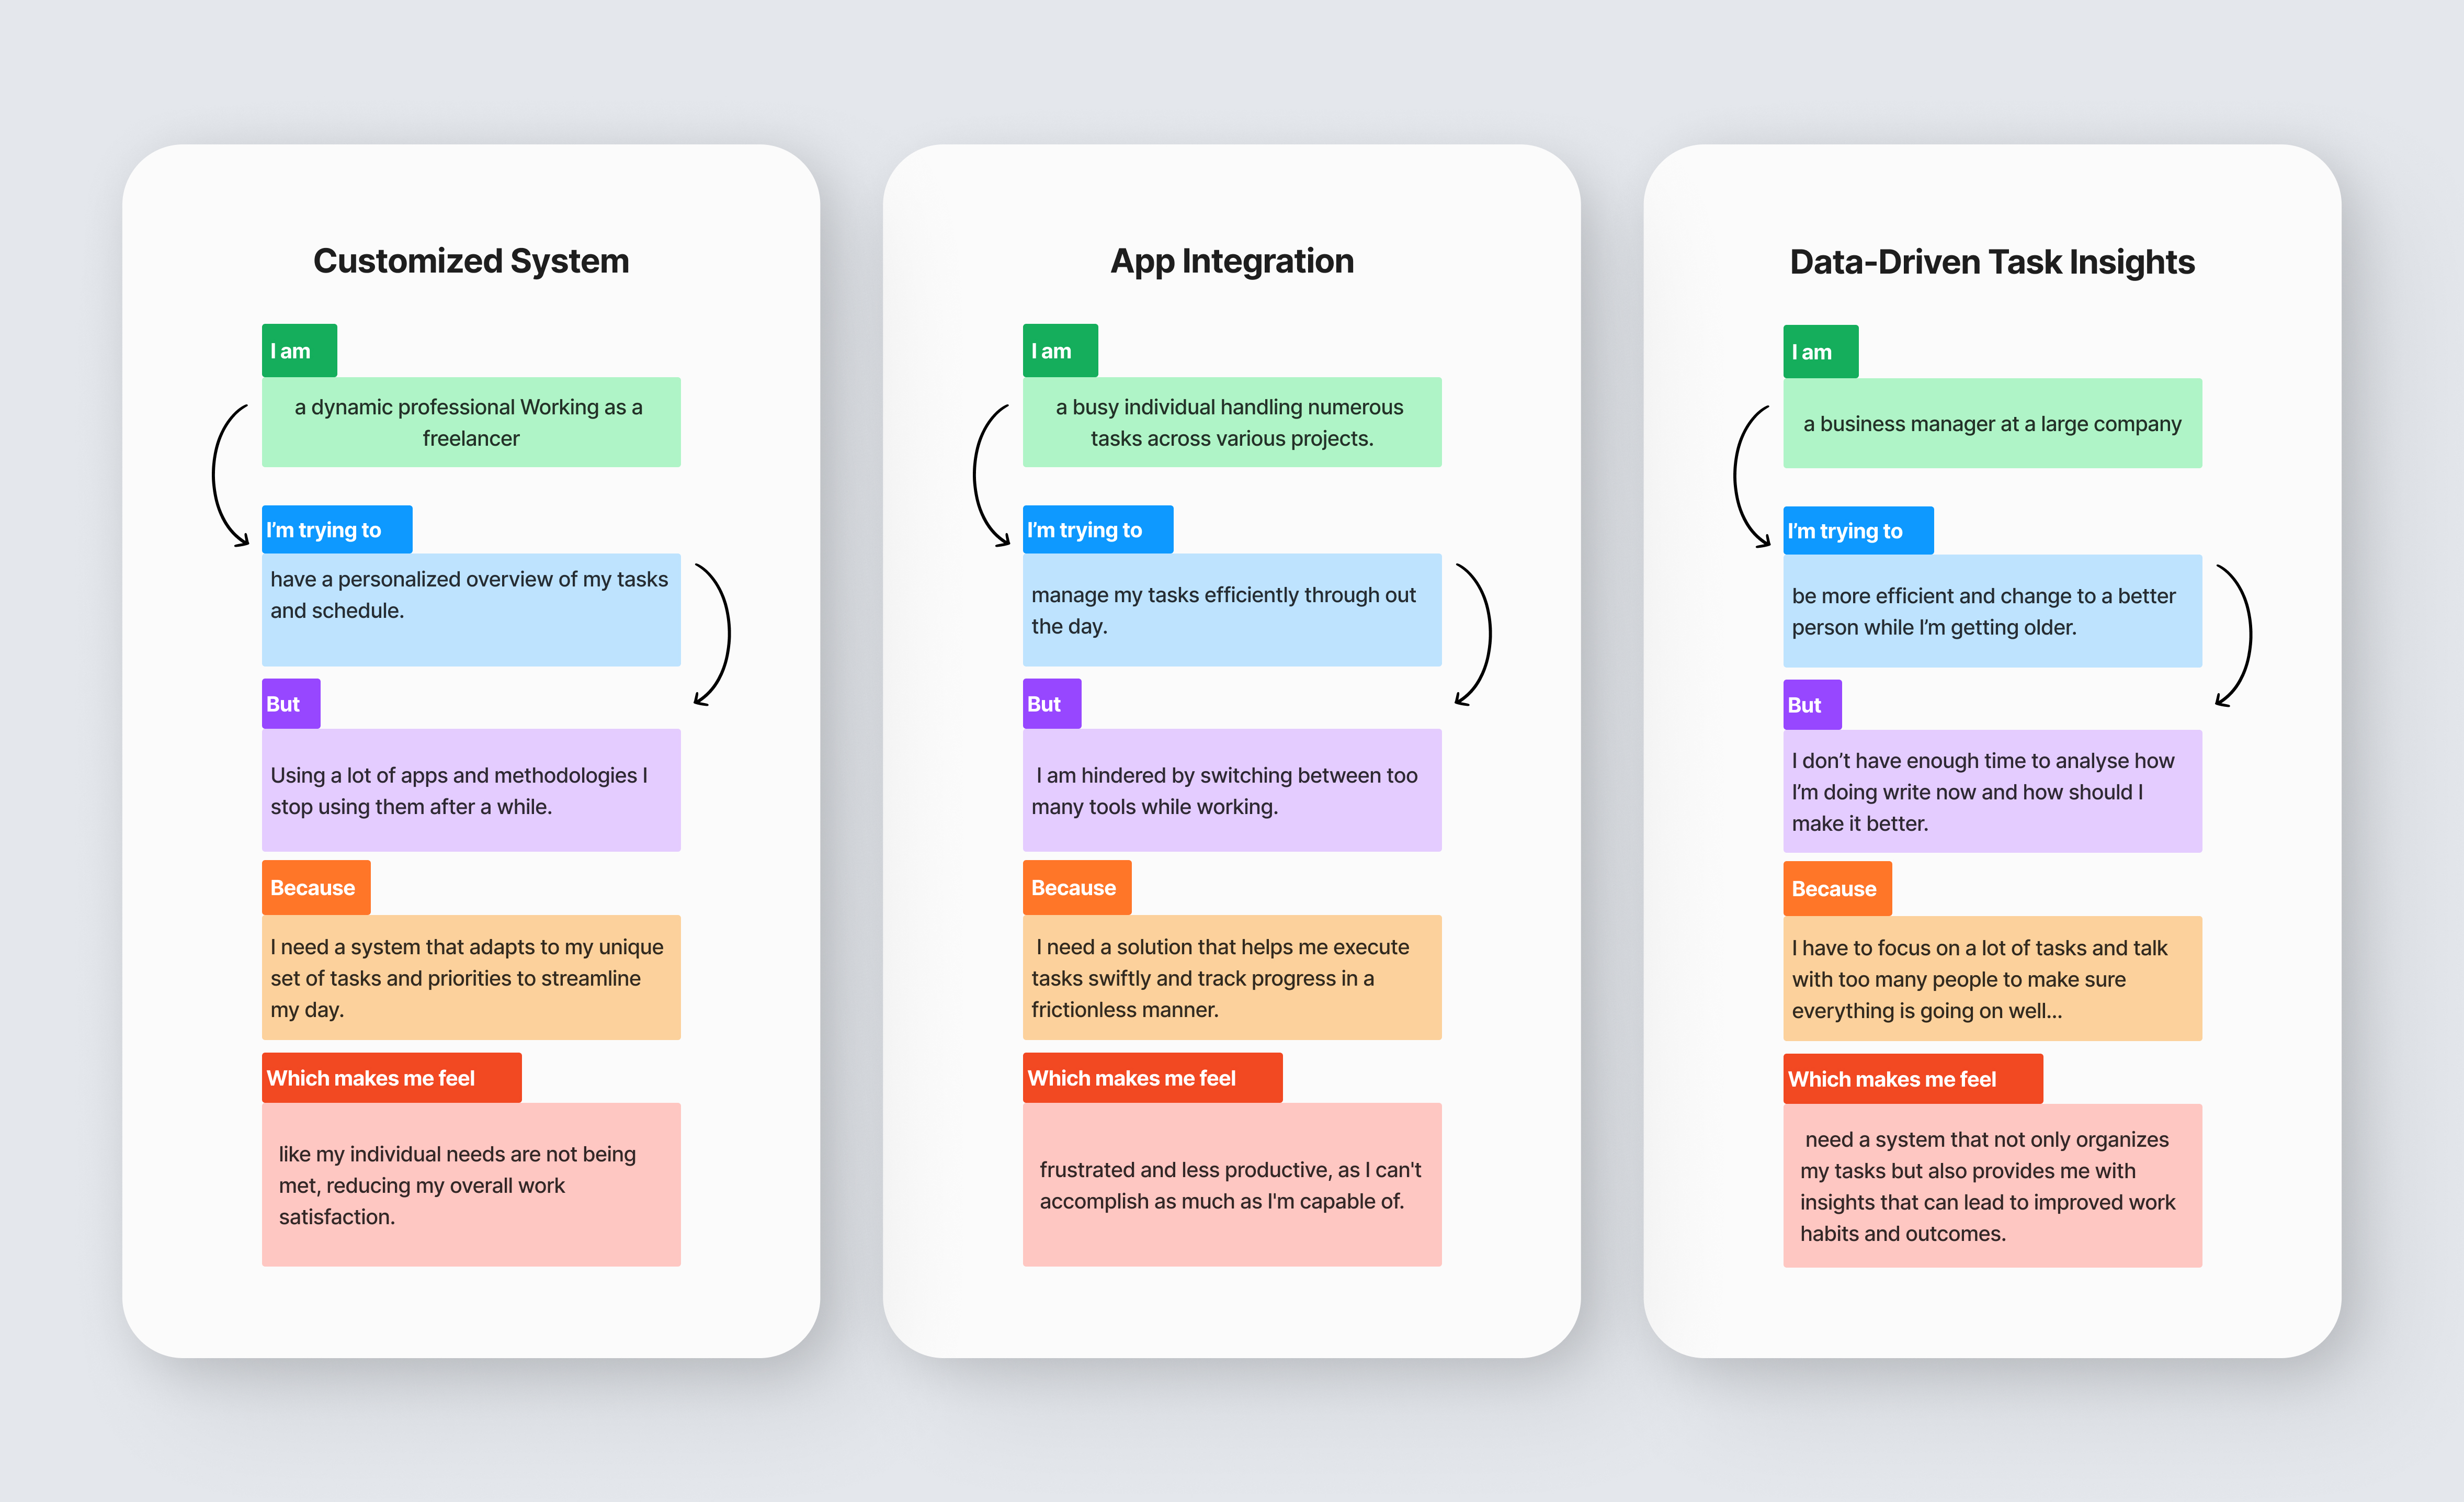
- Defining User Personas and Needs.
Outcomes and Results
- Achieved a 150% increase in the usage of productivity tools in target workspaces.
- Developed robust assets for chart design and information structuring.
Lessons Learned
- Enhanced expertise in data visualization.
- Gained experience in integrating various tools into product design and working with APIs.